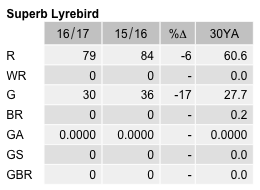
Superb Lyrebird
Menura novaehollandiae
ABR description
The following is extracted from the Annual Bird Report for the twelve months to June 2017.
Uncommon, breeding resident
Occurs in the wetter forests of the ranges. Traditionally considered as “Common” however with the dramatic and continuing decline in the number of records received in recent years, it has been reclassified as “Uncommon”.
General: The reporting rate 0.6% is 2% below the 10 YA and down 74% on the 30YA. The current reporting rate is just below the 0.61% of 2004, the season following the devastating fires of Jan 2003. The reporting rate recovered a little until 2008, but has been in slow but continual decline since then. Average 1.6 and median 1. Most records were from the mountainous country in the ACT and were generally of a single bird. Max 20/18 Jun Camel Back Fire Trail, TNR GrF17 (HeS1). Earliest 1/4 Jul Old Boboyan Rd GrH24 (W S1) and latest 4/28 Jun Tallaganda State Forest GrV19 (W S1). Recorded in all seasons with a summer maximum of 47%. No breeding records. There have only been 4 years in the past 32 years with breeding records.
Abundance
Abundance is the average number of birds of that species per survey. Where the species was observed (presence recorded) but the number of birds seen was not recorded, this is treated as a count of zero.
Abundance by year
This chart shows the abundance of Superb Lyrebird between 1982 and 2017. 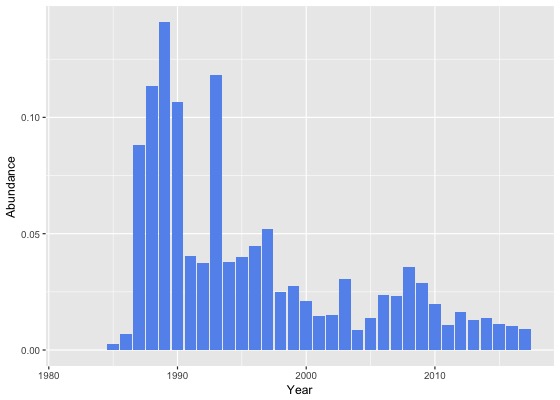
Abundance by month
This chart shows the monthly abundance of Superb Lyrebird. The blue lines show the abundance for the twelve months to June 2017 and the bars show the average abundance for the period 1982 to 2017. 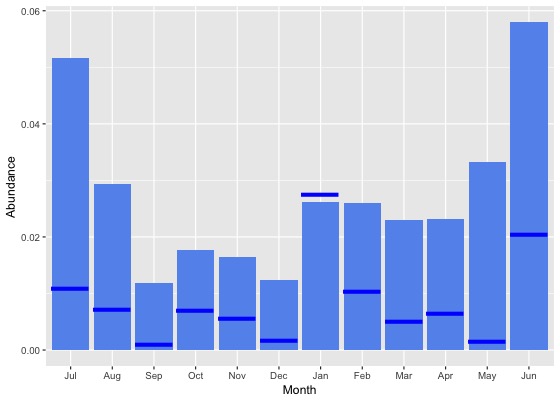
Abundance by season
This chart shows the seasonal abundance of Superb Lyrebird. The blue lines show the seasonal abundance for the twelve months to June 2017 and the bars show the average seasonal abundance for the period 1982 to 2017. 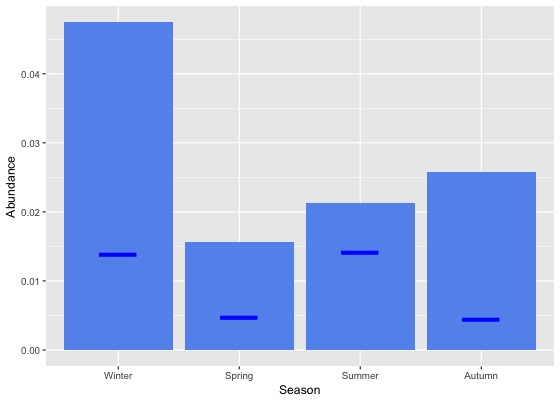
Abundance data
| Month | Season | ||||||||||||||||||
|---|---|---|---|---|---|---|---|---|---|---|---|---|---|---|---|---|---|---|---|
| Period | Jul | Aug | Sep | Oct | Nov | Dec | Jan | Feb | Mar | Apr | May | Jun | Winter | Spring | Summer | Autumn | All | ||
| All years | |||||||||||||||||||
| All | 0.1 | 0.0 | 0.0 | 0.0 | 0.0 | 0.0 | 0.0 | 0.0 | 0.0 | 0.0 | 0.0 | 0.1 | 0.0 | 0.0 | 0.0 | 0.0 | 0.0 | ||
| Previous years | |||||||||||||||||||
| All previous years | 0.1 | 0.0 | 0.0 | 0.0 | 0.0 | 0.0 | 0.0 | 0.0 | 0.0 | 0.0 | 0.0 | 0.1 | 0.1 | 0.0 | 0.0 | 0.0 | 0.0 | ||
| Previous 30 years | 0.1 | 0.0 | 0.0 | 0.0 | 0.0 | 0.0 | 0.0 | 0.0 | 0.0 | 0.0 | 0.0 | 0.1 | 0.1 | 0.0 | 0.0 | 0.0 | 0.0 | ||
| Previous 20 years | 0.0 | 0.0 | 0.0 | 0.0 | 0.0 | 0.0 | 0.0 | 0.0 | 0.0 | 0.0 | 0.0 | 0.1 | 0.0 | 0.0 | 0.0 | 0.0 | 0.0 | ||
| 10 year groups | |||||||||||||||||||
| [2007,2017) | 0.0 | 0.0 | 0.0 | 0.0 | 0.0 | 0.0 | 0.0 | 0.0 | 0.0 | 0.0 | 0.0 | 0.1 | 0.0 | 0.0 | 0.0 | 0.0 | 0.0 | ||
| [1997,2007) | 0.1 | 0.0 | 0.0 | 0.0 | 0.0 | 0.0 | 0.0 | 0.0 | 0.0 | 0.0 | 0.0 | 0.0 | 0.1 | 0.0 | 0.0 | 0.0 | 0.0 | ||
| [1987,1997) | 0.1 | 0.1 | 0.1 | 0.0 | 0.1 | 0.1 | 0.1 | 0.1 | 0.1 | 0.1 | 0.1 | 0.1 | 0.1 | 0.1 | 0.1 | 0.1 | 0.1 | ||
| 5 year groups | |||||||||||||||||||
| [2012,2017) | 0.0 | 0.0 | 0.0 | 0.0 | 0.0 | 0.0 | 0.0 | 0.0 | 0.0 | 0.0 | 0.0 | 0.1 | 0.0 | 0.0 | 0.0 | 0.0 | 0.0 | ||
| [2007,2012) | 0.0 | 0.0 | 0.0 | 0.0 | 0.0 | 0.0 | 0.0 | 0.0 | 0.0 | 0.0 | 0.0 | 0.1 | 0.0 | 0.0 | 0.0 | 0.0 | 0.0 | ||
| [2002,2007) | 0.1 | 0.0 | 0.0 | 0.0 | 0.0 | 0.0 | 0.0 | 0.0 | 0.0 | 0.0 | 0.0 | 0.0 | 0.0 | 0.0 | 0.0 | 0.0 | 0.0 | ||
| [1997,2002) | 0.1 | 0.1 | 0.0 | 0.0 | 0.0 | 0.0 | 0.0 | 0.0 | 0.0 | 0.0 | 0.1 | 0.0 | 0.1 | 0.0 | 0.0 | 0.0 | 0.0 | ||
| [1992,1997) | 0.1 | 0.0 | 0.0 | 0.0 | 0.0 | 0.0 | 0.1 | 0.0 | 0.1 | 0.1 | 0.1 | 0.1 | 0.1 | 0.0 | 0.0 | 0.1 | 0.1 | ||
| [1987,1992) | 0.2 | 0.1 | 0.1 | 0.1 | 0.1 | 0.1 | 0.1 | 0.1 | 0.1 | 0.1 | 0.2 | 0.2 | 0.1 | 0.1 | 0.1 | 0.1 | 0.1 | ||
| Year | |||||||||||||||||||
| 2017 | 0.0 | 0.0 | 0.0 | 0.0 | 0.0 | 0.0 | 0.0 | 0.0 | 0.0 | 0.0 | 0.0 | 0.0 | 0.0 | 0.0 | 0.0 | 0.0 | 0.0 | ||
| 2016 | 0.0 | 0.0 | 0.0 | 0.0 | 0.0 | 0.0 | 0.0 | 0.0 | 0.0 | 0.0 | 0.0 | 0.0 | 0.0 | 0.0 | 0.0 | 0.0 | 0.0 | ||
| 2015 | 0.0 | 0.0 | 0.0 | 0.0 | 0.0 | 0.0 | 0.0 | 0.0 | 0.0 | 0.0 | 0.0 | 0.0 | 0.0 | 0.0 | 0.0 | 0.0 | 0.0 | ||
| 2014 | 0.0 | 0.0 | 0.0 | 0.0 | 0.0 | 0.0 | 0.0 | 0.0 | 0.0 | 0.0 | 0.0 | 0.1 | 0.0 | 0.0 | 0.0 | 0.0 | 0.0 | ||
| 2013 | 0.0 | 0.0 | 0.0 | 0.0 | 0.0 | 0.0 | 0.0 | 0.0 | 0.0 | 0.0 | 0.0 | 0.1 | 0.0 | 0.0 | 0.0 | 0.0 | 0.0 | ||
| 2012 | 0.0 | 0.0 | 0.0 | 0.0 | 0.0 | 0.0 | 0.0 | 0.0 | 0.0 | 0.0 | 0.0 | 0.1 | 0.0 | 0.0 | 0.0 | 0.0 | 0.0 | ||
| 2011 | 0.0 | 0.0 | 0.0 | 0.0 | 0.0 | 0.0 | 0.0 | 0.0 | 0.0 | 0.0 | 0.0 | 0.0 | 0.0 | 0.0 | 0.0 | 0.0 | 0.0 | ||
| 2010 | 0.0 | 0.0 | 0.0 | 0.0 | 0.0 | 0.0 | 0.0 | 0.0 | 0.0 | 0.0 | 0.0 | 0.1 | 0.1 | 0.0 | 0.0 | 0.0 | 0.0 | ||
| 2009 | 0.0 | 0.0 | 0.0 | 0.0 | 0.0 | 0.0 | 0.0 | 0.1 | 0.1 | 0.0 | 0.0 | 0.1 | 0.1 | 0.0 | 0.0 | 0.0 | 0.0 | ||
| 2008 | 0.0 | 0.0 | 0.0 | 0.0 | 0.0 | 0.0 | 0.0 | 0.1 | 0.0 | 0.1 | 0.0 | 0.1 | 0.0 | 0.0 | 0.0 | 0.0 | 0.0 | ||
| 2007 | 0.0 | 0.1 | 0.0 | 0.0 | 0.0 | 0.0 | 0.0 | 0.0 | 0.0 | 0.0 | 0.0 | 0.0 | 0.0 | 0.0 | 0.0 | 0.0 | 0.0 | ||
| 2006 | 0.1 | 0.0 | 0.0 | 0.1 | 0.0 | 0.0 | 0.0 | 0.0 | 0.0 | 0.0 | 0.0 | 0.0 | 0.1 | 0.0 | 0.0 | 0.0 | 0.0 | ||
| 2005 | 0.0 | 0.0 | 0.0 | 0.0 | 0.0 | 0.0 | 0.0 | 0.1 | 0.0 | 0.0 | 0.0 | 0.0 | 0.0 | 0.0 | 0.0 | 0.0 | 0.0 | ||
| 2004 | 0.0 | 0.0 | 0.0 | 0.0 | 0.0 | 0.0 | 0.0 | 0.0 | 0.0 | 0.0 | 0.0 | 0.0 | 0.0 | 0.0 | 0.0 | 0.0 | 0.0 | ||
| 2003 | 0.2 | 0.0 | 0.0 | 0.0 | 0.0 | 0.0 | 0.0 | 0.0 | 0.0 | 0.0 | 0.1 | 0.1 | 0.1 | 0.0 | 0.0 | 0.0 | 0.0 | ||
| 2002 | 0.1 | 0.0 | 0.0 | 0.0 | 0.0 | 0.0 | 0.0 | 0.0 | 0.0 | 0.0 | 0.0 | 0.0 | 0.0 | 0.0 | 0.0 | 0.0 | 0.0 | ||
| 2001 | 0.0 | 0.0 | 0.0 | 0.0 | 0.0 | 0.0 | 0.0 | 0.0 | 0.0 | 0.0 | 0.1 | 0.0 | 0.0 | 0.0 | 0.0 | 0.0 | 0.0 | ||
| 2000 | 0.1 | 0.0 | 0.0 | 0.0 | 0.0 | 0.0 | 0.0 | 0.0 | 0.0 | 0.0 | 0.0 | 0.0 | 0.0 | 0.0 | 0.0 | 0.0 | 0.0 | ||
| 1999 | 0.2 | 0.1 | 0.0 | 0.0 | 0.0 | 0.0 | 0.0 | 0.0 | 0.0 | 0.0 | 0.0 | 0.1 | 0.1 | 0.0 | 0.0 | 0.0 | 0.0 | ||
| 1998 | 0.0 | 0.2 | 0.0 | 0.0 | 0.0 | 0.0 | 0.0 | 0.0 | 0.0 | 0.0 | 0.3 | 0.1 | 0.1 | 0.0 | 0.0 | 0.1 | 0.0 | ||
| 1997 | 0.3 | 0.1 | 0.0 | 0.0 | 0.0 | 0.0 | 0.1 | 0.0 | 0.0 | 0.0 | 0.2 | 0.1 | 0.1 | 0.0 | 0.0 | 0.1 | 0.1 | ||
| 1996 | 0.0 | 0.0 | 0.0 | 0.0 | 0.0 | 0.0 | 0.1 | 0.0 | 0.0 | 0.1 | 0.2 | 0.1 | 0.1 | 0.0 | 0.0 | 0.1 | 0.0 | ||
| 1995 | 0.1 | 0.0 | 0.0 | 0.0 | 0.1 | 0.0 | 0.0 | 0.0 | 0.0 | 0.1 | 0.0 | 0.1 | 0.1 | 0.0 | 0.0 | 0.0 | 0.0 | ||
| 1994 | 0.1 | 0.0 | 0.0 | 0.0 | 0.0 | 0.0 | 0.0 | 0.0 | 0.0 | 0.0 | 0.0 | 0.1 | 0.1 | 0.0 | 0.0 | 0.0 | 0.0 | ||
| 1993 | 0.1 | 0.1 | 0.1 | 0.0 | 0.0 | 0.0 | 0.1 | 0.0 | 0.6 | 0.0 | 0.1 | 0.1 | 0.1 | 0.1 | 0.1 | 0.2 | 0.1 | ||
| 1992 | 0.0 | 0.0 | 0.0 | 0.1 | 0.0 | 0.0 | 0.0 | 0.1 | 0.0 | 0.1 | 0.1 | 0.0 | 0.0 | 0.0 | 0.0 | 0.0 | 0.0 | ||
| 1991 | 0.0 | 0.0 | 0.0 | 0.0 | 0.1 | 0.0 | 0.1 | 0.0 | 0.0 | 0.1 | 0.1 | 0.0 | 0.0 | 0.0 | 0.0 | 0.0 | 0.0 | ||
| 1990 | 0.2 | 0.2 | 0.1 | 0.0 | 0.1 | 0.1 | 0.1 | 0.1 | 0.0 | 0.2 | 0.1 | 0.0 | 0.1 | 0.1 | 0.1 | 0.1 | 0.1 | ||
| 1989 | 0.2 | 0.1 | 0.1 | 0.1 | 0.1 | 0.2 | 0.1 | 0.1 | 0.2 | 0.1 | 0.2 | 0.2 | 0.2 | 0.1 | 0.1 | 0.2 | 0.1 | ||
| 1988 | 0.2 | 0.1 | 0.1 | 0.1 | 0.0 | 0.1 | 0.1 | 0.1 | 0.1 | 0.1 | 0.2 | 0.2 | 0.2 | 0.1 | 0.1 | 0.1 | 0.1 | ||
| 1987 | 0.0 | 0.1 | 0.0 | 0.0 | 0.1 | 0.0 | 0.1 | 0.1 | 0.1 | 0.1 | 0.2 | 0.2 | 0.2 | 0.0 | 0.1 | 0.1 | 0.1 | ||
| 1986 | 0.0 | 0.0 | 0.0 | 0.0 | 0.0 | 0.0 | 0.0 | 0.0 | 0.0 | 0.0 | 0.0 | 0.0 | 0.0 | 0.0 | 0.0 | 0.0 | 0.0 | ||
| 1985 | 0.0 | 0.0 | 0.0 | 0.0 | 0.0 | 0.0 | 0.0 | 0.0 | 0.0 | 0.0 | 0.0 | 0.0 | 0.0 | 0.0 | 0.0 | 0.0 | 0.0 | ||
| 1984 | 0.0 | 0.0 | 0.0 | 0.0 | 0.0 | 0.0 | 0.0 | 0.0 | 0.0 | 0.0 | 0.0 | 0.0 | 0.0 | 0.0 | 0.0 | 0.0 | 0.0 | ||
| 1983 | 0.0 | 0.0 | 0.0 | 0.0 | 0.0 | 0.0 | 0.0 | 0.0 | 0.0 | - | 0.0 | 0.0 | 0.0 | 0.0 | 0.0 | 0.0 | 0.0 | ||
| 1982 | - | 0.0 | - | 0.0 | 0.0 | 0.0 | - | 0.0 | - | 0.0 | - | 0.0 | 0.0 | 0.0 | 0.0 | 0.0 | 0.0 | ||
Reporting rates
Reporting rate is the proportion of all surveys in which the species was present.
Reporting rate by year
This chart shows the reporting rate of Superb Lyrebird each year between 1982 and 2017. 
Reporting rate by month
This chart shows the reporting rate by month of Superb Lyrebird. The blue lines show the reporting rate for the twelve months to June 2017 and the bars show the average reporting rate for the period 1982 to 2017. 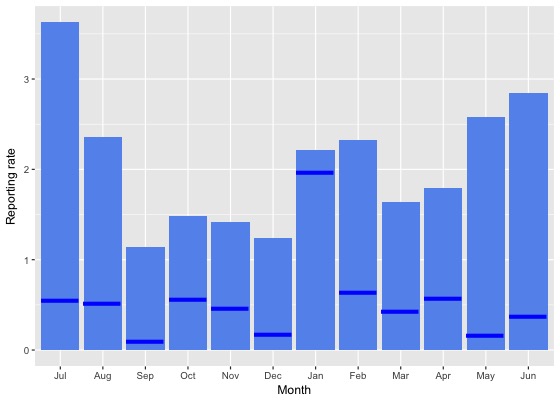
Reporting rate by season
This chart shows the seasonal reporting rate of Superb Lyrebird. The blue lines show the seasonal reporting rate for the twelve months to June 2017 and the bars show the average seasonal reporting rate for the period 1982 to 2017. 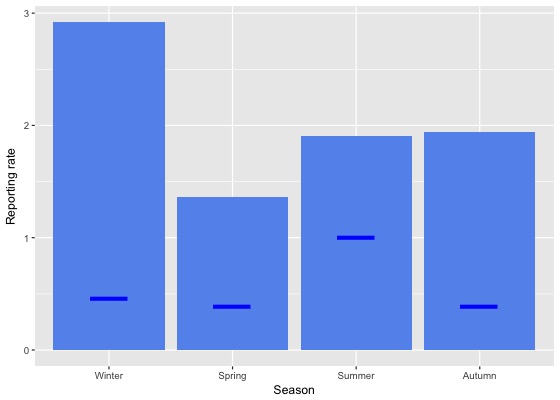
Reporting rate data
| Month | Season | ||||||||||||||||||
|---|---|---|---|---|---|---|---|---|---|---|---|---|---|---|---|---|---|---|---|
| Period | Jul | Aug | Sep | Oct | Nov | Dec | Jan | Feb | Mar | Apr | May | Jun | Winter | Spring | Summer | Autumn | All | ||
| All years | |||||||||||||||||||
| All | 3.6 | 2.4 | 1.1 | 1.5 | 1.4 | 1.2 | 2.2 | 2.3 | 1.6 | 1.8 | 2.6 | 2.8 | 2.9 | 1.4 | 1.9 | 1.9 | 2.0 | ||
| Previous years | |||||||||||||||||||
| All previous years | 4.1 | 2.7 | 1.3 | 1.6 | 1.6 | 1.4 | 2.3 | 2.7 | 1.9 | 2.0 | 3.1 | 3.3 | 3.4 | 1.5 | 2.1 | 2.2 | 2.2 | ||
| Previous 30 years | 4.2 | 2.8 | 1.3 | 1.6 | 1.6 | 1.4 | 2.3 | 2.7 | 1.9 | 2.0 | 3.2 | 3.4 | 3.4 | 1.5 | 2.1 | 2.3 | 2.2 | ||
| Previous 20 years | 1.7 | 1.0 | 0.4 | 1.2 | 0.8 | 0.6 | 1.3 | 1.7 | 0.8 | 0.9 | 0.9 | 1.9 | 1.6 | 0.8 | 1.1 | 0.9 | 1.1 | ||
| 10 year groups | |||||||||||||||||||
| [2007,2017) | 0.8 | 0.7 | 0.4 | 1.3 | 0.6 | 0.6 | 1.2 | 1.5 | 0.8 | 1.0 | 0.6 | 1.8 | 1.2 | 0.9 | 1.1 | 0.8 | 1.0 | ||
| [1997,2007) | 3.2 | 1.7 | 0.4 | 1.0 | 1.1 | 0.6 | 1.8 | 2.1 | 0.9 | 0.6 | 1.6 | 2.3 | 2.4 | 0.8 | 1.4 | 1.0 | 1.3 | ||
| [1987,1997) | 12.7 | 8.0 | 6.1 | 4.1 | 4.3 | 6.2 | 7.9 | 7.7 | 7.8 | 7.8 | 11.7 | 10.6 | 10.3 | 4.7 | 7.3 | 9.0 | 7.7 | ||
| 5 year groups | |||||||||||||||||||
| [2012,2017) | 0.9 | 0.5 | 0.4 | 0.8 | 0.3 | 0.3 | 1.1 | 1.1 | 0.5 | 0.9 | 0.3 | 1.7 | 1.1 | 0.6 | 0.8 | 0.6 | 0.8 | ||
| [2007,2012) | 0.5 | 1.4 | 0.4 | 2.0 | 1.5 | 1.1 | 1.5 | 3.4 | 1.5 | 1.2 | 1.5 | 1.9 | 1.4 | 1.5 | 1.7 | 1.4 | 1.5 | ||
| [2002,2007) | 3.1 | 1.1 | 0.4 | 1.4 | 0.6 | 0.3 | 1.0 | 2.0 | 0.6 | 0.4 | 0.9 | 2.2 | 2.3 | 0.8 | 0.9 | 0.6 | 1.1 | ||
| [1997,2002) | 3.3 | 2.5 | 0.4 | 0.5 | 1.7 | 1.0 | 2.7 | 2.1 | 1.3 | 0.8 | 2.4 | 2.4 | 2.7 | 0.8 | 1.8 | 1.4 | 1.6 | ||
| [1992,1997) | 3.4 | 1.9 | 1.8 | 1.9 | 1.4 | 2.1 | 3.6 | 1.4 | 4.1 | 3.0 | 3.3 | 2.8 | 2.6 | 1.7 | 2.5 | 3.5 | 2.5 | ||
| [1987,1992) | 16.9 | 11.3 | 8.2 | 5.2 | 5.7 | 8.1 | 10.3 | 10.1 | 10.0 | 10.5 | 16.1 | 15.0 | 14.3 | 6.2 | 9.5 | 12.1 | 10.3 | ||
| Year | |||||||||||||||||||
| 2017 | 0.5 | 0.5 | 0.1 | 0.6 | 0.5 | 0.2 | 2.0 | 0.6 | 0.4 | 0.6 | 0.2 | 0.4 | 0.5 | 0.4 | 1.0 | 0.4 | 0.6 | ||
| 2016 | 1.1 | 0.4 | 0.8 | 1.1 | 0.0 | 0.2 | 0.9 | 1.3 | 0.4 | 0.5 | 0.3 | 1.5 | 1.0 | 0.7 | 0.9 | 0.4 | 0.7 | ||
| 2015 | 0.2 | 0.0 | 0.1 | 0.4 | 0.2 | 0.4 | 0.9 | 1.0 | 0.7 | 1.1 | 0.0 | 1.5 | 0.7 | 0.3 | 0.8 | 0.6 | 0.6 | ||
| 2014 | 0.0 | 1.3 | 0.0 | 0.8 | 0.0 | 0.4 | 1.4 | 0.5 | 0.8 | 1.8 | 1.1 | 2.1 | 1.4 | 0.4 | 0.9 | 1.2 | 0.9 | ||
| 2013 | 2.3 | 0.5 | 0.2 | 0.3 | 1.3 | 0.3 | 0.9 | 1.5 | 0.2 | 0.5 | 0.4 | 2.2 | 1.7 | 0.6 | 0.8 | 0.3 | 0.8 | ||
| 2012 | 1.2 | 0.8 | 0.2 | 1.4 | 0.5 | 0.3 | 1.3 | 1.0 | 0.3 | 1.7 | 0.0 | 2.1 | 1.4 | 0.9 | 0.9 | 0.8 | 1.0 | ||
| 2011 | 0.0 | 0.8 | 1.2 | 0.8 | 0.6 | 0.0 | 0.6 | 3.2 | 1.2 | 0.9 | 0.7 | 0.6 | 0.5 | 0.9 | 1.0 | 1.0 | 0.9 | ||
| 2010 | 2.1 | 0.9 | 0.0 | 2.1 | 1.4 | 1.5 | 1.4 | 0.0 | 0.8 | 0.4 | 1.0 | 1.9 | 1.7 | 1.4 | 1.2 | 0.7 | 1.2 | ||
| 2009 | 0.0 | 1.0 | 0.0 | 2.2 | 1.8 | 0.5 | 1.3 | 4.2 | 3.7 | 0.4 | 3.8 | 3.2 | 1.8 | 1.5 | 1.7 | 2.4 | 1.8 | ||
| 2008 | 0.0 | 0.9 | 0.4 | 2.6 | 2.7 | 1.8 | 2.4 | 6.5 | 2.2 | 2.8 | 0.9 | 2.3 | 1.3 | 2.0 | 3.1 | 2.3 | 2.1 | ||
| 2007 | 1.1 | 3.7 | 0.4 | 2.3 | 0.7 | 1.7 | 2.4 | 2.6 | 0.0 | 0.9 | 1.6 | 2.0 | 2.2 | 1.4 | 2.1 | 0.7 | 1.6 | ||
| 2006 | 3.3 | 1.0 | 0.0 | 3.3 | 0.0 | 0.6 | 1.1 | 2.2 | 1.2 | 0.0 | 0.0 | 1.9 | 2.1 | 1.7 | 1.2 | 0.6 | 1.4 | ||
| 2005 | 2.2 | 0.0 | 0.4 | 0.0 | 0.0 | 0.4 | 4.3 | 4.3 | 0.0 | 0.0 | 1.0 | 1.9 | 1.6 | 0.2 | 2.3 | 0.3 | 1.0 | ||
| 2004 | 2.0 | 0.7 | 0.0 | 1.2 | 1.2 | 0.0 | 0.0 | 1.0 | 0.0 | 0.5 | 0.0 | 0.0 | 1.1 | 0.7 | 0.2 | 0.2 | 0.6 | ||
| 2003 | 7.7 | 2.9 | 1.3 | 0.0 | 0.0 | 0.0 | 0.0 | 1.1 | 0.9 | 0.5 | 2.3 | 3.7 | 4.6 | 0.5 | 0.4 | 1.1 | 1.4 | ||
| 2002 | 2.3 | 0.8 | 0.0 | 0.4 | 1.5 | 0.6 | 0.0 | 2.0 | 0.5 | 1.2 | 1.2 | 3.8 | 2.5 | 0.6 | 0.8 | 0.8 | 1.1 | ||
| 2001 | 2.7 | 1.8 | 0.0 | 1.3 | 1.1 | 1.8 | 2.5 | 2.1 | 0.9 | 0.0 | 2.9 | 1.5 | 2.0 | 0.7 | 2.1 | 1.1 | 1.4 | ||
| 2000 | 3.2 | 2.0 | 0.9 | 0.0 | 3.2 | 1.0 | 2.5 | 1.4 | 2.4 | 1.8 | 0.0 | 2.7 | 2.6 | 1.4 | 1.6 | 1.7 | 1.8 | ||
| 1999 | 2.9 | 4.1 | 0.6 | 0.6 | 1.9 | 0.0 | 3.6 | 5.0 | 1.1 | 1.0 | 1.1 | 3.3 | 3.5 | 1.0 | 2.7 | 1.1 | 1.9 | ||
| 1998 | 0.0 | 3.8 | 0.8 | 0.0 | 0.0 | 0.0 | 0.0 | 0.0 | 0.0 | 0.0 | 11.1 | 2.7 | 2.4 | 0.3 | 0.0 | 1.9 | 0.9 | ||
| 1997 | 6.9 | 1.7 | 0.0 | 0.0 | 0.9 | 1.0 | 5.9 | 0.0 | 2.5 | 0.0 | 6.7 | 1.4 | 3.7 | 0.3 | 1.9 | 2.1 | 1.8 | ||
| 1996 | 1.5 | 2.1 | 0.0 | 0.0 | 0.0 | 2.0 | 2.9 | 2.4 | 1.0 | 3.1 | 5.2 | 2.3 | 2.0 | 0.0 | 2.4 | 2.7 | 1.7 | ||
| 1995 | 5.4 | 2.3 | 0.0 | 0.6 | 3.6 | 2.3 | 1.8 | 0.0 | 0.0 | 3.2 | 2.6 | 3.2 | 3.5 | 1.3 | 1.5 | 2.0 | 2.1 | ||
| 1994 | 3.9 | 0.0 | 0.0 | 3.5 | 0.7 | 4.3 | 4.4 | 0.0 | 2.3 | 2.3 | 2.5 | 4.5 | 2.8 | 1.4 | 2.9 | 2.3 | 2.2 | ||
| 1993 | 4.1 | 2.6 | 8.1 | 2.7 | 3.0 | 2.2 | 8.2 | 0.0 | 17.3 | 1.7 | 3.9 | 1.4 | 2.6 | 4.4 | 3.9 | 8.3 | 5.0 | ||
| 1992 | 1.5 | 1.9 | 2.4 | 4.3 | 0.0 | 0.0 | 3.4 | 4.9 | 1.4 | 5.1 | 2.6 | 1.7 | 1.7 | 2.4 | 2.5 | 2.9 | 2.4 | ||
| 1991 | 2.4 | 1.1 | 0.0 | 1.9 | 4.1 | 0.0 | 7.1 | 2.0 | 0.0 | 5.1 | 1.6 | 2.0 | 1.8 | 2.1 | 2.8 | 2.2 | 2.2 | ||
| 1990 | 20.6 | 15.1 | 12.9 | 1.0 | 7.5 | 8.3 | 8.3 | 8.5 | 3.4 | 4.8 | 2.7 | 1.3 | 14.7 | 7.0 | 8.4 | 3.7 | 9.3 | ||
| 1989 | 23.0 | 11.2 | 13.5 | 6.5 | 8.6 | 15.2 | 12.2 | 13.9 | 17.2 | 13.3 | 24.3 | 15.5 | 16.3 | 9.5 | 13.9 | 17.8 | 14.1 | ||
| 1988 | 18.1 | 12.7 | 6.7 | 7.8 | 4.2 | 6.2 | 12.6 | 9.1 | 10.9 | 12.8 | 19.7 | 16.9 | 15.7 | 6.1 | 9.3 | 14.5 | 11.3 | ||
| 1987 | 0.0 | 6.7 | 5.3 | 4.3 | 5.1 | 4.7 | 7.7 | 10.0 | 8.6 | 9.9 | 15.7 | 21.1 | 19.1 | 4.9 | 7.6 | 11.5 | 8.9 | ||
| 1986 | 0.0 | 2.6 | 0.0 | 0.0 | 2.1 | 0.0 | 0.0 | 0.0 | 3.2 | 0.0 | 0.0 | 0.0 | 1.0 | 0.7 | 0.0 | 0.9 | 0.7 | ||
| 1985 | 0.0 | 0.0 | 0.0 | 0.0 | 0.0 | 0.0 | 0.0 | 0.0 | 0.0 | 0.0 | 0.0 | 3.6 | 1.1 | 0.0 | 0.0 | 0.0 | 0.2 | ||
| 1984 | 0.0 | 0.0 | 0.0 | 0.0 | 0.0 | 0.0 | 0.0 | 0.0 | 0.0 | 0.0 | 0.0 | 0.0 | 0.0 | 0.0 | 0.0 | 0.0 | 0.0 | ||
| 1983 | 0.0 | 0.0 | 0.0 | 0.0 | 0.0 | 0.0 | 0.0 | 0.0 | 0.0 | - | 0.0 | 0.0 | 0.0 | 0.0 | 0.0 | 0.0 | 0.0 | ||
| 1982 | - | 0.0 | - | 0.0 | 0.0 | 0.0 | - | 0.0 | - | 0.0 | - | 0.0 | 0.0 | 0.0 | 0.0 | 0.0 | 0.0 | ||
Breeding data
Breeding records by month
Number of breeding records by breeding code and month, 2017 and all years| Breeding code | Jul | Aug | Sep | Oct | Nov | Dec | Jan | Feb | Mar | Apr | May | Jun |
|---|---|---|---|---|---|---|---|---|---|---|---|---|
| 2017 | ||||||||||||
| Breeding (BLA code) | 0 | 1 | 0 | 0 | 0 | 0 | 0 | 0 | 0 | 0 | 0 | 0 |
| Carrying Food | 0 | 0 | 0 | 0 | 0 | 0 | 0 | 0 | 0 | 0 | 0 | 0 |
| Copulating | 0 | 0 | 0 | 0 | 0 | 0 | 0 | 0 | 0 | 0 | 0 | 0 |
| Display | 0 | 0 | 0 | 0 | 0 | 0 | 0 | 0 | 0 | 0 | 0 | 0 |
| Dependent young | 0 | 0 | 0 | 0 | 0 | 0 | 0 | 0 | 0 | 0 | 0 | 0 |
| Faecal sac | 0 | 0 | 0 | 0 | 0 | 0 | 0 | 0 | 0 | 0 | 0 | 0 |
| Inspecting hollow | 0 | 0 | 0 | 0 | 0 | 0 | 0 | 0 | 0 | 0 | 0 | 0 |
| Nest building | 0 | 0 | 0 | 0 | 0 | 0 | 0 | 0 | 0 | 0 | 0 | 0 |
| Nest with eggs | 0 | 0 | 0 | 0 | 0 | 0 | 0 | 0 | 0 | 0 | 0 | 0 |
| Nest with young | 0 | 0 | 0 | 0 | 0 | 0 | 0 | 0 | 0 | 0 | 0 | 0 |
| On/leaving nest | 0 | 0 | 0 | 0 | 0 | 0 | 0 | 0 | 0 | 0 | 0 | 0 |
| All years | ||||||||||||
| Breeding (BLA code) | 0 | 1 | 0 | 0 | 0 | 0 | 0 | 0 | 0 | 0 | 0 | 0 |
| Carrying Food | 0 | 0 | 0 | 0 | 0 | 0 | 0 | 0 | 0 | 0 | 0 | 0 |
| Copulating | 0 | 0 | 0 | 0 | 0 | 0 | 0 | 0 | 0 | 0 | 0 | 0 |
| Display | 0 | 0 | 0 | 0 | 0 | 0 | 0 | 0 | 0 | 1 | 0 | 0 |
| Dependent young | 0 | 0 | 0 | 1 | 0 | 0 | 0 | 0 | 0 | 0 | 1 | 0 |
| Faecal sac | 0 | 0 | 0 | 0 | 0 | 0 | 0 | 0 | 0 | 0 | 0 | 0 |
| Inspecting hollow | 0 | 0 | 0 | 0 | 0 | 0 | 0 | 0 | 0 | 0 | 0 | 0 |
| Nest building | 0 | 0 | 0 | 0 | 0 | 0 | 0 | 0 | 0 | 0 | 1 | 0 |
| Nest with eggs | 0 | 0 | 2 | 0 | 0 | 0 | 0 | 0 | 0 | 0 | 0 | 0 |
| Nest with young | 0 | 0 | 1 | 0 | 0 | 0 | 0 | 0 | 0 | 0 | 0 | 0 |
| On/leaving nest | 0 | 0 | 0 | 0 | 0 | 0 | 0 | 0 | 0 | 0 | 0 | 0 |
Breeding records by year
Average number of breeding records per period by breeding code| Period | Breeding (BLA code) | Carrying Food | Copulating | Display | Dependent young | Faecal sac | Inspecting hollow | Nest building | Nest with eggs | Nest with young | On/leaving nest |
|---|---|---|---|---|---|---|---|---|---|---|---|
| All years | |||||||||||
| All | 0.0 | 0.0 | 0.0 | 0.0 | 0.1 | 0.0 | 0.0 | 0.0 | 0.1 | 0.0 | 0.0 |
| Previous years | |||||||||||
| All previous years | 0.0 | 0.0 | 0.0 | 0.0 | 0.1 | 0.0 | 0.0 | 0.0 | 0.1 | 0.0 | 0.0 |
| Previous 30 years | 0.0 | 0.0 | 0.0 | 0.0 | 0.1 | 0.0 | 0.0 | 0.0 | 0.1 | 0.0 | 0.0 |
| Previous 20 years | 0.0 | 0.0 | 0.0 | 0.0 | 0.0 | 0.0 | 0.0 | 0.0 | 0.0 | 0.0 | 0.0 |
| 10 year groups | |||||||||||
| [2007,2017) | 0.0 | 0.0 | 0.0 | 0.1 | 0.0 | 0.0 | 0.0 | 0.0 | 0.0 | 0.0 | 0.0 |
| [1997,2007) | 0.0 | 0.0 | 0.0 | 0.0 | 0.0 | 0.0 | 0.0 | 0.0 | 0.0 | 0.0 | 0.0 |
| [1987,1997) | 0.0 | 0.0 | 0.0 | 0.0 | 0.2 | 0.0 | 0.0 | 0.1 | 0.2 | 0.1 | 0.0 |
| 5 year groups | |||||||||||
| [2012,2017) | 0.0 | 0.0 | 0.0 | 0.0 | 0.0 | 0.0 | 0.0 | 0.0 | 0.0 | 0.0 | 0.0 |
| [2007,2012) | 0.0 | 0.0 | 0.0 | 0.2 | 0.0 | 0.0 | 0.0 | 0.0 | 0.0 | 0.0 | 0.0 |
| [2002,2007) | 0.0 | 0.0 | 0.0 | 0.0 | 0.0 | 0.0 | 0.0 | 0.0 | 0.0 | 0.0 | 0.0 |
| [1997,2002) | 0.0 | 0.0 | 0.0 | 0.0 | 0.0 | 0.0 | 0.0 | 0.0 | 0.0 | 0.0 | 0.0 |
| [1992,1997) | 0.0 | 0.0 | 0.0 | 0.0 | 0.0 | 0.0 | 0.0 | 0.0 | 0.0 | 0.0 | 0.0 |
| [1987,1992) | 0.0 | 0.0 | 0.0 | 0.0 | 0.4 | 0.0 | 0.0 | 0.2 | 0.4 | 0.2 | 0.0 |
| Year | |||||||||||
| 2017 | 1.0 | 0.0 | 0.0 | 0.0 | 0.0 | 0.0 | 0.0 | 0.0 | 0.0 | 0.0 | 0.0 |
| 2016 | 0.0 | 0.0 | 0.0 | 0.0 | 0.0 | 0.0 | 0.0 | 0.0 | 0.0 | 0.0 | 0.0 |
| 2015 | 0.0 | 0.0 | 0.0 | 0.0 | 0.0 | 0.0 | 0.0 | 0.0 | 0.0 | 0.0 | 0.0 |
| 2014 | 0.0 | 0.0 | 0.0 | 0.0 | 0.0 | 0.0 | 0.0 | 0.0 | 0.0 | 0.0 | 0.0 |
| 2013 | 0.0 | 0.0 | 0.0 | 0.0 | 0.0 | 0.0 | 0.0 | 0.0 | 0.0 | 0.0 | 0.0 |
| 2012 | 0.0 | 0.0 | 0.0 | 0.0 | 0.0 | 0.0 | 0.0 | 0.0 | 0.0 | 0.0 | 0.0 |
| 2011 | 0.0 | 0.0 | 0.0 | 0.0 | 0.0 | 0.0 | 0.0 | 0.0 | 0.0 | 0.0 | 0.0 |
| 2010 | 0.0 | 0.0 | 0.0 | 0.0 | 0.0 | 0.0 | 0.0 | 0.0 | 0.0 | 0.0 | 0.0 |
| 2009 | 0.0 | 0.0 | 0.0 | 0.0 | 0.0 | 0.0 | 0.0 | 0.0 | 0.0 | 0.0 | 0.0 |
| 2008 | 0.0 | 0.0 | 0.0 | 1.0 | 0.0 | 0.0 | 0.0 | 0.0 | 0.0 | 0.0 | 0.0 |
| 2007 | 0.0 | 0.0 | 0.0 | 0.0 | 0.0 | 0.0 | 0.0 | 0.0 | 0.0 | 0.0 | 0.0 |
| 2006 | 0.0 | 0.0 | 0.0 | 0.0 | 0.0 | 0.0 | 0.0 | 0.0 | 0.0 | 0.0 | 0.0 |
| 2005 | 0.0 | 0.0 | 0.0 | 0.0 | 0.0 | 0.0 | 0.0 | 0.0 | 0.0 | 0.0 | 0.0 |
| 2004 | 0.0 | 0.0 | 0.0 | 0.0 | 0.0 | 0.0 | 0.0 | 0.0 | 0.0 | 0.0 | 0.0 |
| 2003 | 0.0 | 0.0 | 0.0 | 0.0 | 0.0 | 0.0 | 0.0 | 0.0 | 0.0 | 0.0 | 0.0 |
| 2002 | 0.0 | 0.0 | 0.0 | 0.0 | 0.0 | 0.0 | 0.0 | 0.0 | 0.0 | 0.0 | 0.0 |
| 2001 | 0.0 | 0.0 | 0.0 | 0.0 | 0.0 | 0.0 | 0.0 | 0.0 | 0.0 | 0.0 | 0.0 |
| 2000 | 0.0 | 0.0 | 0.0 | 0.0 | 0.0 | 0.0 | 0.0 | 0.0 | 0.0 | 0.0 | 0.0 |
| 1999 | 0.0 | 0.0 | 0.0 | 0.0 | 0.0 | 0.0 | 0.0 | 0.0 | 0.0 | 0.0 | 0.0 |
| 1998 | 0.0 | 0.0 | 0.0 | 0.0 | 0.0 | 0.0 | 0.0 | 0.0 | 0.0 | 0.0 | 0.0 |
| 1997 | 0.0 | 0.0 | 0.0 | 0.0 | 0.0 | 0.0 | 0.0 | 0.0 | 0.0 | 0.0 | 0.0 |
| 1996 | 0.0 | 0.0 | 0.0 | 0.0 | 0.0 | 0.0 | 0.0 | 0.0 | 0.0 | 0.0 | 0.0 |
| 1995 | 0.0 | 0.0 | 0.0 | 0.0 | 0.0 | 0.0 | 0.0 | 0.0 | 0.0 | 0.0 | 0.0 |
| 1994 | 0.0 | 0.0 | 0.0 | 0.0 | 0.0 | 0.0 | 0.0 | 0.0 | 0.0 | 0.0 | 0.0 |
| 1993 | 0.0 | 0.0 | 0.0 | 0.0 | 0.0 | 0.0 | 0.0 | 0.0 | 0.0 | 0.0 | 0.0 |
| 1992 | 0.0 | 0.0 | 0.0 | 0.0 | 0.0 | 0.0 | 0.0 | 0.0 | 0.0 | 0.0 | 0.0 |
| 1991 | 0.0 | 0.0 | 0.0 | 0.0 | 0.0 | 0.0 | 0.0 | 0.0 | 0.0 | 0.0 | 0.0 |
| 1990 | 0.0 | 0.0 | 0.0 | 0.0 | 0.0 | 0.0 | 0.0 | 0.0 | 0.0 | 0.0 | 0.0 |
| 1989 | 0.0 | 0.0 | 0.0 | 0.0 | 1.0 | 0.0 | 0.0 | 0.0 | 1.0 | 0.0 | 0.0 |
| 1988 | 0.0 | 0.0 | 0.0 | 0.0 | 1.0 | 0.0 | 0.0 | 1.0 | 0.0 | 0.0 | 0.0 |
| 1987 | 0.0 | 0.0 | 0.0 | 0.0 | 0.0 | 0.0 | 0.0 | 0.0 | 1.0 | 1.0 | 0.0 |
| 1986 | 0.0 | 0.0 | 0.0 | 0.0 | 0.0 | 0.0 | 0.0 | 0.0 | 0.0 | 0.0 | 0.0 |
| 1985 | 0.0 | 0.0 | 0.0 | 0.0 | 0.0 | 0.0 | 0.0 | 0.0 | 0.0 | 0.0 | 0.0 |
| 1984 | 0.0 | 0.0 | 0.0 | 0.0 | 0.0 | 0.0 | 0.0 | 0.0 | 0.0 | 0.0 | 0.0 |
| 1983 | 0.0 | 0.0 | 0.0 | 0.0 | 0.0 | 0.0 | 0.0 | 0.0 | 0.0 | 0.0 | 0.0 |
| 1982 | 0.0 | 0.0 | 0.0 | 0.0 | 0.0 | 0.0 | 0.0 | 0.0 | 0.0 | 0.0 | 0.0 |
Distribution map
Distribution - 2017
This map shows the observed distribution of the Superb Lyrebird for 2017.
The red circles are the grid cells where Superb Lyrebird have been reported.
The transparency of the red circles indicate how many surveys sheets were submitted for that grid cell; the darker the red the more reliable the data. Of the 315 grid cells with reports, 83 had only one sheet; an example is grid number D22.
The size of the circle represents the reporting rate. The maximum reporting rate for Superb Lyrebird was 100.0% (eg grid number D22) and the minimum was 1.1% (eg grid number I15). 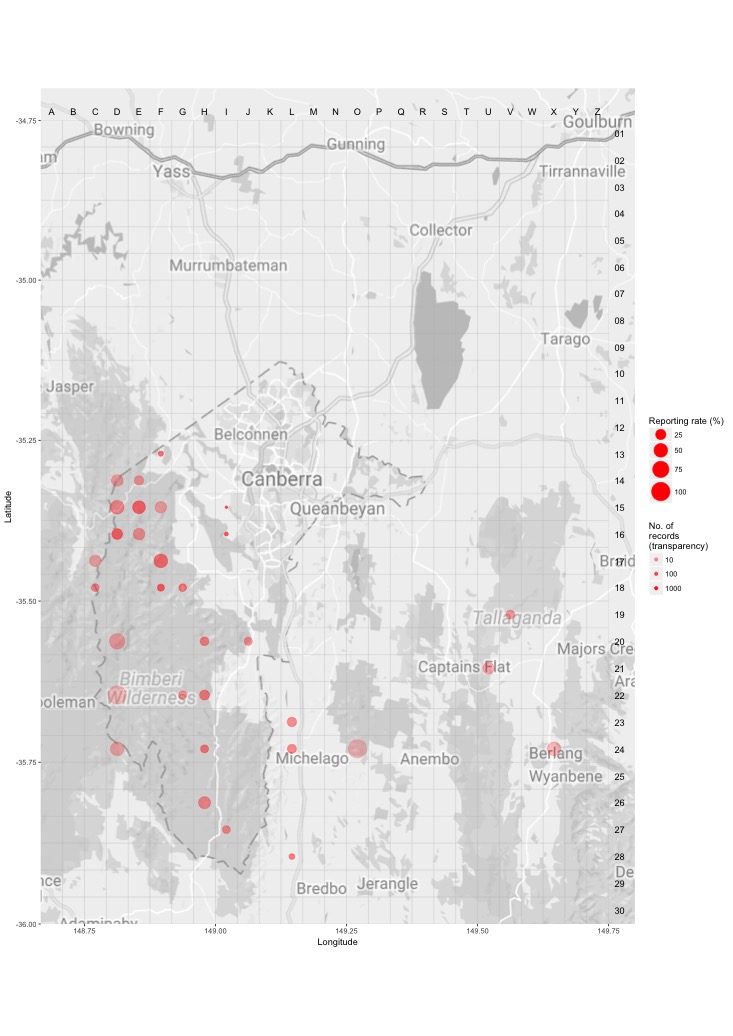
Distribution - all years
This map shows the observed distribution of the Superb Lyrebird for all years.
The red circles are the grid cells where Superb Lyrebird have been reported.
The transparency of the red circles indicate how many surveys sheets were submitted for that grid cell; the darker the red the more reliable the data. Of the 703 grid cells with reports, 55 had only one sheet; an example is grid number A5.
The size of the circle represents the reporting rate. The maximum reporting rate for Superb Lyrebird was 100.0% (eg grid number A28) and the minimum was 0.0% (eg grid number L14). 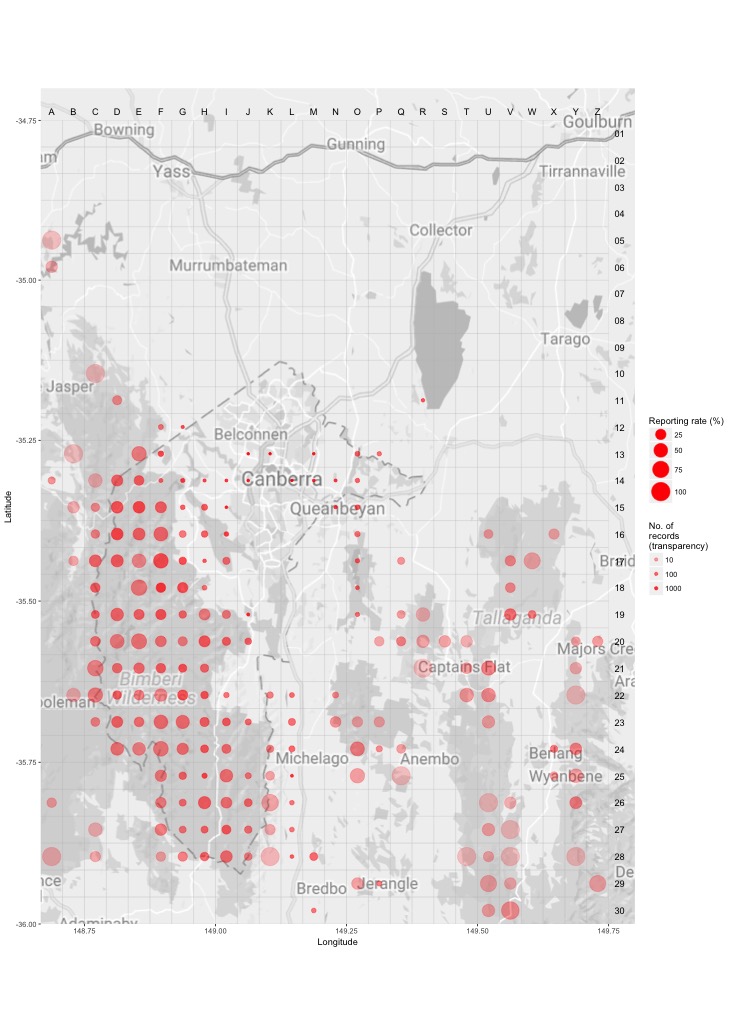
Breeding map
Breeding - 2017
This map shows the breeding distribution of the Superb Lyrebird for 2017.
The red circles are the grid cells where breeding activity for Superb Lyrebird have been reported.
The size of the circle represents the number of reports. 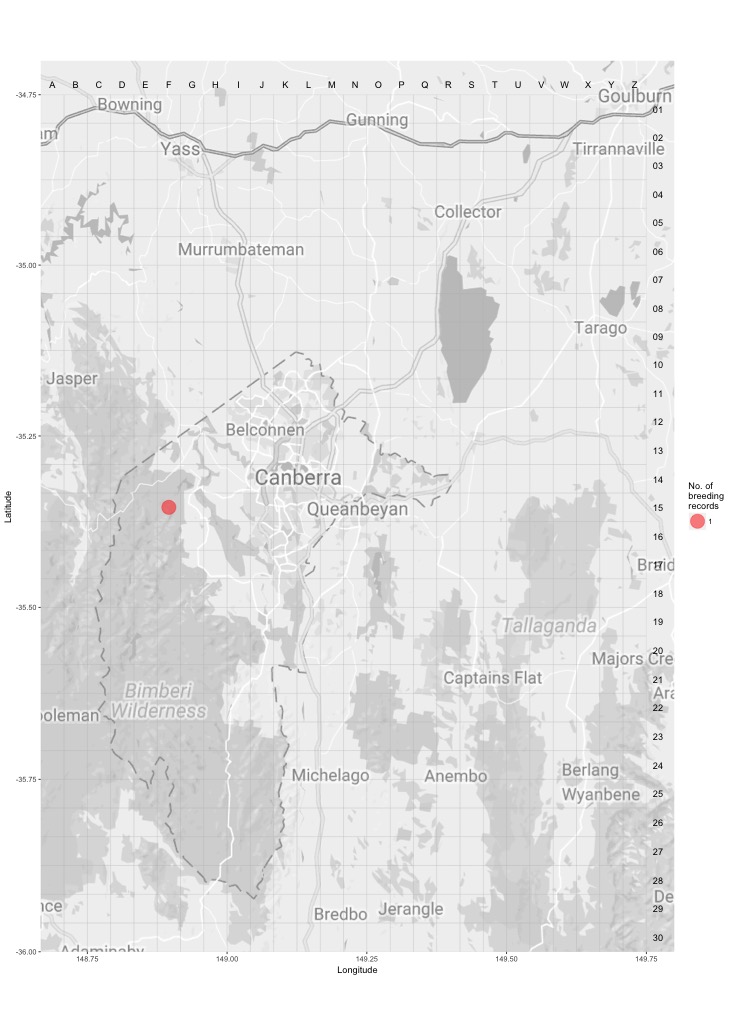
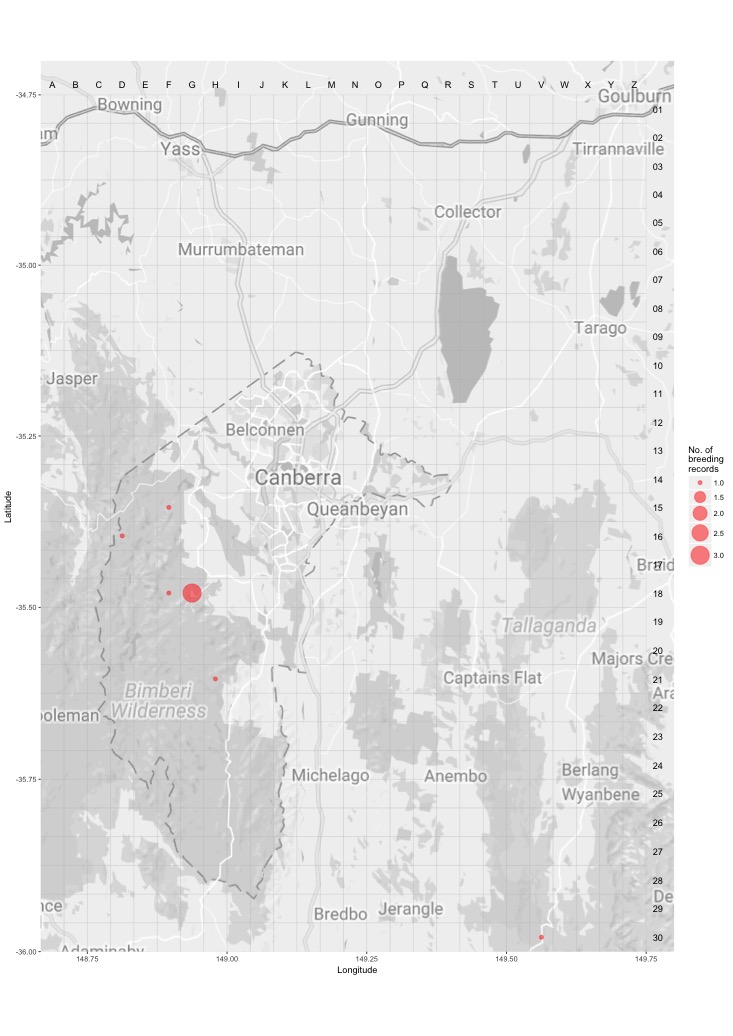
Breeding - all years
This map shows the breeding distribution of the Superb Lyrebird for all years.
The red circles are the grid cells where breeding activity for Superb Lyrebird have been reported.
The size of the circle represents the number of reports.